Flare
Flare is an OpenTelemetry Java agent extension for Apache Spark. It gives you one trace per Spark application, from the driver down to the individual task on the executor, plus task and stage metrics and trace-linked logs. No code changes: you add two JARs and a few Spark settings.
These docs describe Flare 1.4.0. Upgrading lists what changed between releases.
| If you want to | Start with |
|---|---|
| See Flare working on your machine, with Grafana | Local stack |
| Add it to a Spark you already run | Quick start |
| Run it on Kubernetes, EMR, Dataproc or Databricks | Deploying |
| Find out why nothing arrives | Troubleshooting |

What you get
spark.application                          (driver)
├── spark.sql.0                            (driver)
│   ├── spark.job.0                        (driver)
│   │   └── spark.stage.0                  (driver)
│   │       ├── spark.task.executor        (executor)
│   │       └── spark.task.executor        (executor)
│   └── spark.job.1                        (driver)
│       └── spark.stage.2                  (driver)
│           └── spark.task.executor        (executor)
└── spark.sql.1                            (driver)
    └── spark.job.2                        (driver)
        └── spark.stage.4                  (driver)
            └── spark.task.executor        (executor)
Task spans need FLARE_TRACE_GRANULARITY=all, or tasks. The default, stages, stops at the stage
spans, which keeps volume down; see Configuration.
Most Spark observability stops at the driver. You get a stage with an aggregate duration, but not which executor ran slow, which partition was skewed, or where a retry happened. Flare creates the task spans on the executor itself, with the executor's own timing, and parents each one to its stage across the JVM boundary.
- Traces: the full
application → sql → job → stage → taskhierarchy, with SQL plans, stage metrics and failure detail as attributes. See Spans. - Metrics: task duration and throughput histograms with exemplars back to the trace, shuffle and stage counters, executor lifecycle. See Metrics.
- Logs: driver and executor logs exported with the trace and span id of the task that wrote them. See Exporting.
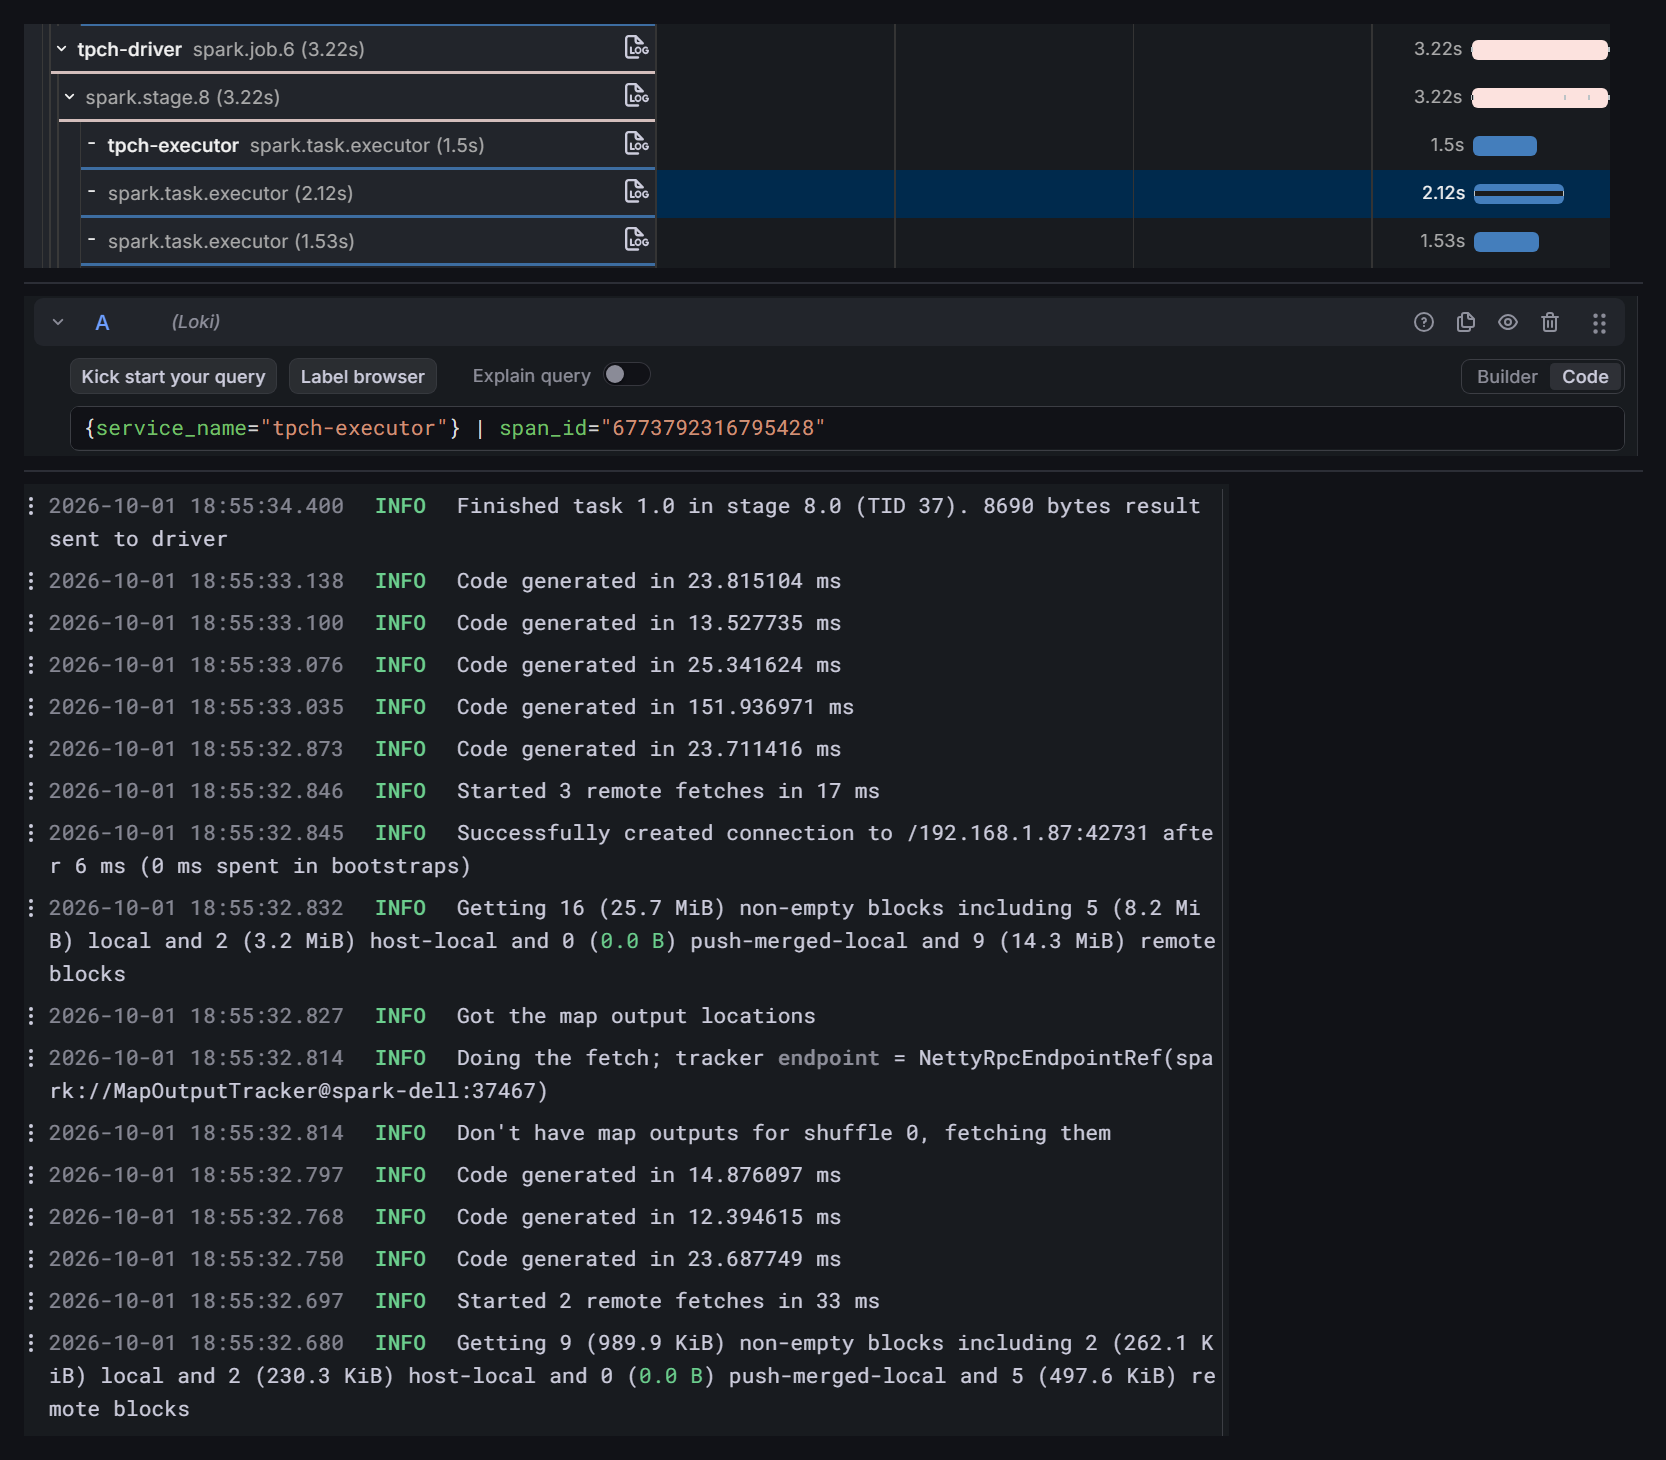
Everything goes out over OTLP, so any OpenTelemetry backend works: Grafana (Tempo, Mimir, Loki), Jaeger, Honeycomb, Datadog and others.
How it works
Flare runs inside the OpenTelemetry Java agent.
On the driver it hooks the scheduler, so every stage gets its own W3C traceparent, which Spark
carries to the executors inside each task's properties. On the executor, Flare restores that
context before the task runs and opens the task span under it. Anything else traced inside the
task nests under the task span: your own spans, or a JDBC query or HTTP call once you turn the
agent's instrumentation for it back on, which Flare keeps off by default
(Agent instrumentation).
Where it runs
Verified on real clusters: standalone, YARN, Kubernetes (including the Spark Operator), Amazon EMR and EMR Serverless, Google Dataproc and Dataproc Serverless, and Databricks on AWS and Azure. See Deploying for each, and Platforms that cannot run Flare for the ones where the agent cannot be attached.
Start here
- Quick start: one
spark-submitwith Flare attached. - Choosing a JAR: which of the seven artifacts matches your Spark.
- Deploying: the recipe for your platform.